Chaos Rules..
About Chaos --
In the 17th and 18th centuries, Newtonian mechanics was triumphant in its explanation of the solar system. In fact, many theologians at that time pictured God as a great clockmaker, who had only to start the universe and then step back and let Newton’s laws determine the future. But does everything in the universe run like a fine clock? The nineteenth century mathematician Poincaré found an exception—the motion of three mutually interacting astronomical objects. When the three objects have comparable mass, as suggested in the drawing, the motion of each body produces a substantial change in the gravitational field experienced by the other two, thereby making a solution impossible.
The only way to tackle this kind of problem is by a series of iterations—calculate the gravitational forces, let the objects move for a short time under these forces, then recalculate the forces based on the objects’ new positions, etc. Even without a computer, Poincaré could see that the resulting orbits were aperiodic and wildly disordered. Moreover he discovered that a small change in the initial conditions—the initial positions and velocities of the three objects—produced a huge change in the orbits. This important observation was to lie fallow for eighty years, awaiting the development of chaos theory.
Step outside and behold a chaotic system—the weather. Although there are short-term patterns, the system never repeats, and long-range forecasting remains an unsolved problem. Back in the 1960s, meteorologist Ed Lorenz build a simple computer weather model that, when given some initial values, chugged out numbers that corresponded to wind speed, precipitation, and temperature. Then this output went back in as the new input, and the model generated simple predictions over time.
Desiring to repeat a particular computer run, Lorenz restarted the computer but rounded down the initial values from six significant figures to three. Since temperatures weren’t measured to three significant figures of accuracy anyway, this approximation should have had no effect. And indeed, the output of the new run at first followed that of the old, but slowly and steadily the two diverged, as shown in the first graph, until the results were completely different and continued so, as shown in the graph. Lorenz was stunned—a change in input too small to correspond to a measurable difference had totally altered the output. Lorenz’ result exemplifies “exquisite sensitivity to initial conditions,” otherwise known as the butterfly effect—the beat of a butterfly’s wing in China could, in principle, change the weather in New York .

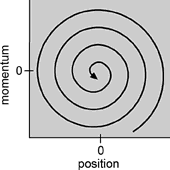
This image is a phase space graph for a pendulum with friction. Each point corresponds to a state of particular position and momentum, and the succession of points around the curve correspond to the evolution of the system with time. As friction erodes the amplitude and speed of the bob, the phase space plot spirals in to the equilibrium position and zero momentum (zero speed)
Lorenz presented his simulation results with a graph of what physicists call “phase space.” In this space, each axis of the graph corresponds to a system variable, such as the position and momentum of a particle, so the entire state of the system can be expressed by the point in phase space it occupies at a certain time. A pendulum with friction would have a phase space diagram like that shown in the second graph, a spiral that winds in to a point, as energy dissipates and the pendulum amplitude and speed progressively decrease. For more on the phase space of a pendulum, see the first link.

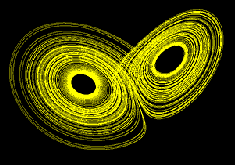
The Lorenz attractor, displaying the order present in a chaotic system. The graph never crosses itself, so the system never repeats its state. (image courtesy of Glenn Elert)
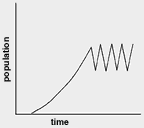
Ecology can lead to chaos. In describing population dynamics, one of the key variables is the rate of growth, which is related to the animal’s fertility. As this rate increases, the equilibrium population at first goes up. But with further increase, the population alternates between two different values, as shown in the first graph. In fact, such seemingly implausible behavior had been observed, but ecologists assumed that there was an equilibrium in between the alternating populations, obscured by some ecological complication .

An animal population plotted vs time. The population gyrates between two values, so there is no equilibrium.
In the 1970s, the biologist Robert May, who began as a theoretical physicist, made a thorough study of the simple quadratic equation .
xn+1 = rxn(xn – 1)
Here xn is equal to the population in the n th generation, and it has been scaled to a maximum value of one for convenience. This equation describes how a population changes from the nth generation to the (n+1)th. In other words, the population in each generation is a function of the population in the previous generation. The symbol “r” is the rate of growth. The factor (xn – 1) expresses the effects on a large population of limited food supply or overcrowding—in this simple model, when the population reaches one, all the organisms die.
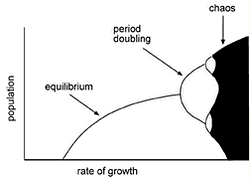
May investigated the effect of the rate of growth. At first, increasing this rate likewise increased the equilibrium population, as expected (see the second graph). But with further increase in growth rate, the curve splits, and the population has two values, which alternate, so there is no equilibrium. This case corresponds to the first graph above. As fertility increases further, the curve splits again, until it finally enters regions of chaotic behavior. The above equation had been around since the 1950s, yet biologists had been unable to recognize this prediction. They looked only for equilibrium, so they missed chaos.

The classic period-doubling graph, a hallmark of chaos. This particular graph shows the dependence of an animal population on its rate of growth. At a certain value of the rate, there is no equilibrium population, and the number gyrates between two values, as in the first graph on this page. This process of “bifurcation” continues, and the population then dissolves into chaos (the black region).
A surprising and compelling example of chaos turned out to be a familiar system that had never been investigated—the dripping faucet. Robert Shaw, a physics grad student in the 1970s, decided to investigate the faucet’s flow by timing the dripping. When the water flow is low, the result is a steady dripping that increases its rate as the faucet is turned. As the system is driven harder by increasing the flow, the constant interval between drops gives way to two alternating intervals (e.g., successive drips separated by .3 sec, .1 sec, .3 sec, .l sec), just as with May’s mathematical description of animal populations. Then, at higher flow rates, each of the two different intervals itself subdivides; a still higher rate provokes chaotic behavior, with no discernable pattern. The appearance of chaos in this everyday system, and the precise analysis of the time series, made a deep impression on many physicists.
Chaos became an accepted field of physics research only in the 1980s. Before then, physics journal editors were reluctant to publish chaos papers, so the early workers had to struggle for professional recognition. To many physicists, the emergence of chaos into the physics mainstream, and the overthrow of part of Newtonian determinism, have been nothing short of revolutionary. Chaos is studied actively, and you can read more about it in future Physics in Actions.

In the 17th and 18th centuries, Newtonian mechanics was triumphant in its explanation of the solar system. In fact, many theologians at that time pictured God as a great clockmaker, who had only to start the universe and then step back and let Newton’s laws determine the future. But does everything in the universe run like a fine clock? The nineteenth century mathematician Poincaré found an exception—the motion of three mutually interacting astronomical objects. When the three objects have comparable mass, as suggested in the drawing, the motion of each body produces a substantial change in the gravitational field experienced by the other two, thereby making a solution impossible.
The only way to tackle this kind of problem is by a series of iterations—calculate the gravitational forces, let the objects move for a short time under these forces, then recalculate the forces based on the objects’ new positions, etc. Even without a computer, Poincaré could see that the resulting orbits were aperiodic and wildly disordered. Moreover he discovered that a small change in the initial conditions—the initial positions and velocities of the three objects—produced a huge change in the orbits. This important observation was to lie fallow for eighty years, awaiting the development of chaos theory.
Step outside and behold a chaotic system—the weather. Although there are short-term patterns, the system never repeats, and long-range forecasting remains an unsolved problem. Back in the 1960s, meteorologist Ed Lorenz build a simple computer weather model that, when given some initial values, chugged out numbers that corresponded to wind speed, precipitation, and temperature. Then this output went back in as the new input, and the model generated simple predictions over time.
Desiring to repeat a particular computer run, Lorenz restarted the computer but rounded down the initial values from six significant figures to three. Since temperatures weren’t measured to three significant figures of accuracy anyway, this approximation should have had no effect. And indeed, the output of the new run at first followed that of the old, but slowly and steadily the two diverged, as shown in the first graph, until the results were completely different and continued so, as shown in the graph. Lorenz was stunned—a change in input too small to correspond to a measurable difference had totally altered the output. Lorenz’ result exemplifies “exquisite sensitivity to initial conditions,” otherwise known as the butterfly effect—the beat of a butterfly’s wing in China could, in principle, change the weather in New York .

This image is a phase space graph for a pendulum with friction. Each point corresponds to a state of particular position and momentum, and the succession of points around the curve correspond to the evolution of the system with time. As friction erodes the amplitude and speed of the bob, the phase space plot spirals in to the equilibrium position and zero momentum (zero speed)
Lorenz presented his simulation results with a graph of what physicists call “phase space.” In this space, each axis of the graph corresponds to a system variable, such as the position and momentum of a particle, so the entire state of the system can be expressed by the point in phase space it occupies at a certain time. A pendulum with friction would have a phase space diagram like that shown in the second graph, a spiral that winds in to a point, as energy dissipates and the pendulum amplitude and speed progressively decrease. For more on the phase space of a pendulum, see the first link.

The Lorenz attractor, displaying the order present in a chaotic system. The graph never crosses itself, so the system never repeats its state. (image courtesy of Glenn Elert)
When Lorenz drew a phase space plot for his weather simulation, the results were quite different, as shown in the third graph, where the curve continues indefinitely without repeating itself and winds around and around the two points. This graph, dubbed the “strange attractor,” eventually became a potent symbol for the young field of chaos research.
Many systems show chaotic behavior. To name just a few—
- animal populations
- the red spot of Jupiter
- electrical signals in the human heart
- convection
Ecology can lead to chaos. In describing population dynamics, one of the key variables is the rate of growth, which is related to the animal’s fertility. As this rate increases, the equilibrium population at first goes up. But with further increase, the population alternates between two different values, as shown in the first graph. In fact, such seemingly implausible behavior had been observed, but ecologists assumed that there was an equilibrium in between the alternating populations, obscured by some ecological complication .

An animal population plotted vs time. The population gyrates between two values, so there is no equilibrium.
In the 1970s, the biologist Robert May, who began as a theoretical physicist, made a thorough study of the simple quadratic equation .
xn+1 = rxn(xn – 1)
Here xn is equal to the population in the n th generation, and it has been scaled to a maximum value of one for convenience. This equation describes how a population changes from the nth generation to the (n+1)th. In other words, the population in each generation is a function of the population in the previous generation. The symbol “r” is the rate of growth. The factor (xn – 1) expresses the effects on a large population of limited food supply or overcrowding—in this simple model, when the population reaches one, all the organisms die.
May investigated the effect of the rate of growth. At first, increasing this rate likewise increased the equilibrium population, as expected (see the second graph). But with further increase in growth rate, the curve splits, and the population has two values, which alternate, so there is no equilibrium. This case corresponds to the first graph above. As fertility increases further, the curve splits again, until it finally enters regions of chaotic behavior. The above equation had been around since the 1950s, yet biologists had been unable to recognize this prediction. They looked only for equilibrium, so they missed chaos.

The classic period-doubling graph, a hallmark of chaos. This particular graph shows the dependence of an animal population on its rate of growth. At a certain value of the rate, there is no equilibrium population, and the number gyrates between two values, as in the first graph on this page. This process of “bifurcation” continues, and the population then dissolves into chaos (the black region).
A surprising and compelling example of chaos turned out to be a familiar system that had never been investigated—the dripping faucet. Robert Shaw, a physics grad student in the 1970s, decided to investigate the faucet’s flow by timing the dripping. When the water flow is low, the result is a steady dripping that increases its rate as the faucet is turned. As the system is driven harder by increasing the flow, the constant interval between drops gives way to two alternating intervals (e.g., successive drips separated by .3 sec, .1 sec, .3 sec, .l sec), just as with May’s mathematical description of animal populations. Then, at higher flow rates, each of the two different intervals itself subdivides; a still higher rate provokes chaotic behavior, with no discernable pattern. The appearance of chaos in this everyday system, and the precise analysis of the time series, made a deep impression on many physicists.
Chaos became an accepted field of physics research only in the 1980s. Before then, physics journal editors were reluctant to publish chaos papers, so the early workers had to struggle for professional recognition. To many physicists, the emergence of chaos into the physics mainstream, and the overthrow of part of Newtonian determinism, have been nothing short of revolutionary. Chaos is studied actively, and you can read more about it in future Physics in Actions.

A different view of a Lorenz attractor (image courtesy of Paul Bourke, Centre for Astrophysics and Supercomputing, Swinburne University)


0 Comments:
Post a Comment
<< Home